
Importance of Interactive Visaulizations
Introduction
If you think about it, so far in this series, we talked only about visual representations that are completely static means that they don't change over time, and they don't change when somebody interacts with them because there's no interruption. The focus of this article is about interaction.
Goal
The goal of the rest of this module is to go systematically through all the methods that exist to make a visualization interactive and to create multiple linked or coordinated views. So views that are linked in a way that when I interact with one view, the interaction is propagated to the other views. As we will see, there are many, many options here. And one of the goals for me here is to give us a mental model to think about interaction and multiple views in a way that it's not just a list of techniques, but it also helps us understand why these methods are useful, and when it is appropriate to use them.
Information Visualization Pipeline
Why manipulate visualization?
-
If we want the visualization to be able to adapt, in a way that it makes it possible for us to answer questions, then we have in some way to interact with the system so that the system changes help us answering the new questions that we have.
-
It allows us to visualize information when it's needed without overloading the visualization.
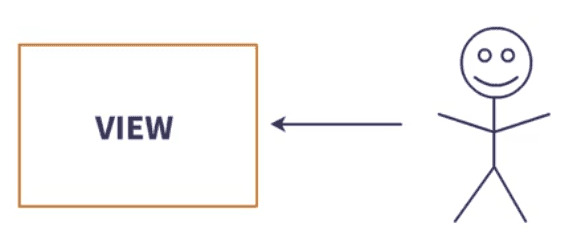
Single View
Single view methods are methods that work within the scope of a single visualization.
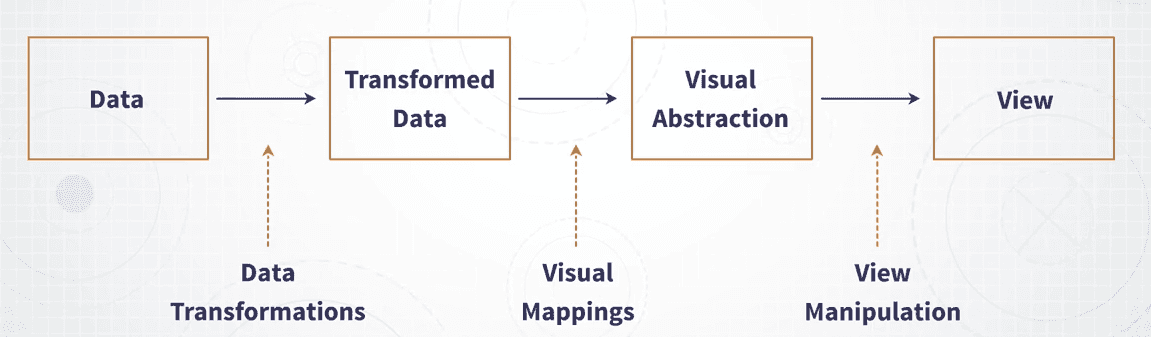
All of the methods that we see here in this list below that I'm going to describe in detail. They all pertain to different steps of the information visualization pipeline.
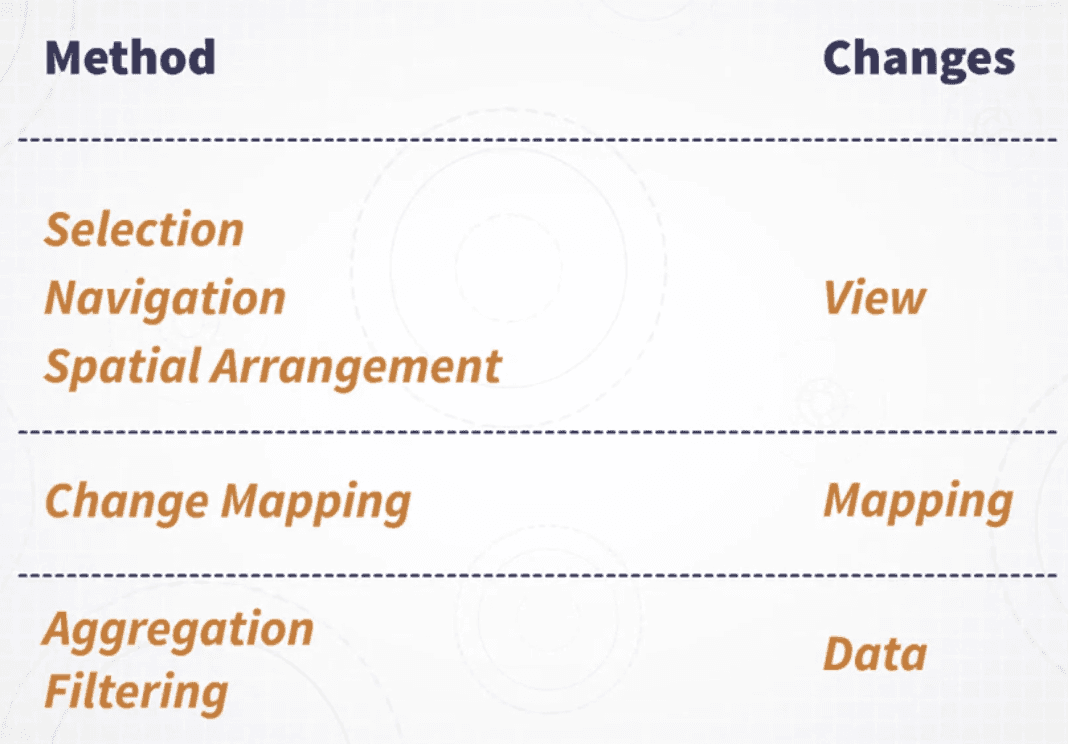
we will start with methods that cover changes in the view. Then we will move on to methods that change the mapping, and then methods that change the data.
Selection
-
Selection is any action, any interactive action that we make that is aimed at selecting one or more elements in your visualization and typically these elements can be either item and or attributes from the dataset.
-
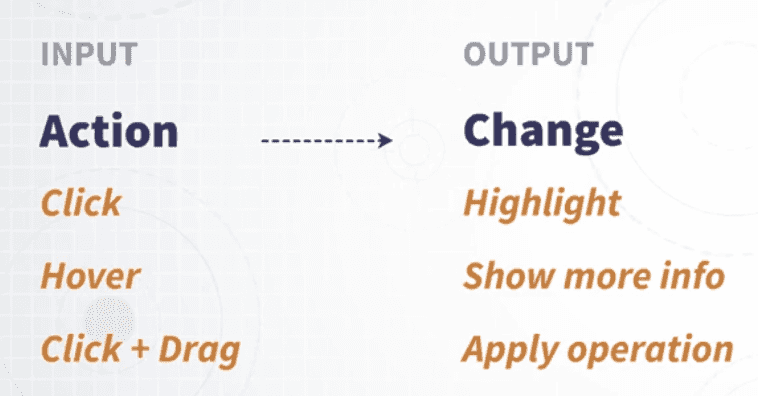
We typically have three main types of actions in current visual interfaces.
- A simple click: Clicking on some elements on the screen and selecting it.
- Hovering: Hover over the elements with mouse and as we get closer, close enough to appoint something happens. Eg: a pop-up label showing up.
- Click and Drag: Selecting an area, then we can select and draw an area, then we can select all those elements that are underneath the area.
Changes triggered by a selection
-
Highlighting
- When we select something on the screen, we want to highlight it because we want to communicate the idea that these elements have been selected.
- Ways of highlighting on the screen
- Change the color or the border of an element.
- When selecting some elements on the screen, the other elements that are not selected are grayed out or made transparent.
-
Show more information
- In general, another important reaction of selection is showing more information about the elements that we've just selected.
-
Apply an operation
-
Focus on something
-
Save/label the elements
Navigation
- The basic idea of navigation is that we may want to interact with the visualization so
that we can change the level of details at which something is represented.
-
We may zoom in or zoom out.
-
We may want to move the viewpoint of the visualization so that we can observe parts of the visualizations that are currently hidden by the view.
-
Zooming is going into the details of visual representation or zooming out.
-
Panning is moving the visualization in the viewport so that you can see hidden areas and navigate through the space of the visualization
-
Semantic zooming, is that what information is presented at a given zoom level, and at what level of detail changes with that zoom level.
Spatial Arrangement
-
Spatial arrangement is any interaction that changes the arrangement of the objects on the screen.
-
A very common and very powerful type of rearrangement is reordering, to reorder the objects that are displayed on the screen in a way that it enables the viewer to pursue different types of questions. E.g: Alphabetical, Ascending, Descending
-
Reordering can be automatic and manual.
Change Mapping
-
The basic idea is that interactions that change the mapping are interactions that affect the way data is translated into a visualization.
-
It can lead to changes in the parameters of an existing graph or more dramatic changes that lead to a reconfiguration of the visualization.
Aggregation
-
The idea here is, using interaction to change the level of aggregation or the level of details that are used to represent and visualize a given dataset.
-
Every time we are visualizing spatial or temporal information, we always have in principle this option of representing more information with more or fewer details.
-
Some patterns can be discerned better at a high level of granularity or low level of granularity and that's the reason why being able to interactively change the level of granularity is a very very useful and very powerful method, in general, to use in an interactive visualization.
Filtering
-
The basic idea here is that another thing we can do interactively in visualization is to filter out some of the elements that are currently displayed on the screen according to some criteria.
-
Dynamic filtering is the idea of using sliders or other types of user interface widgets in a way that we can change the range of values of a given attribute to tell the system to visualize only those items that are within the ranges that have been specified.
-
This is very powerful because I can interactively ask my system and my visualization to show only the elements that satisfy some of the constraints I'm interested in.
Multiple Linked View
Multiple views methods are methods that require multiple views and having these views linked in some way.
In a visualization system or application, we can in principle use multiple views to visualize data at the same time with different views.
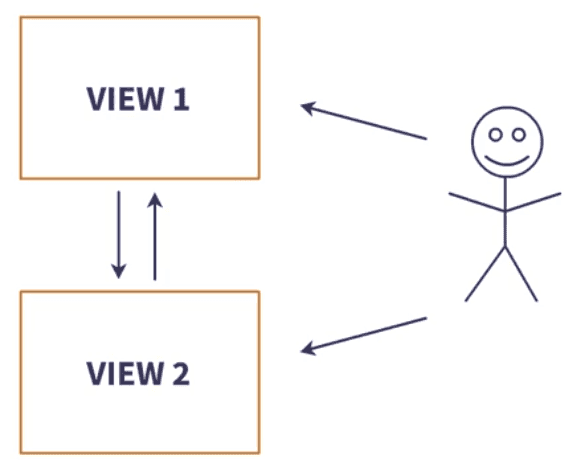
An interesting idea of multiple views is that these views can be used not only to visualize different aspects of the same data but also to make sure that when we interact with one view, the interaction is reflected in the other view.
Reasons for using multiple views
- It's not always possible to visualize all the information that we want to extract from a given dataset in one single view. A typical example is datasets that contain information about, say the geography of somethings, spatial information, and temporal information.
- There are situations out there where it may be useful to actually rather than integrate everything in one single view, at one view that depicts the temporal aspects of the data, and one view that represents the spatial aspects of the data, and then link them together in a way that when we interact with time, we can see the effect on space and the other way around.
Three main types of connections between views
- Navigation - Navigate information in one view, see the details of this navigation in the other view.
- Selection - When we select some elements in one view, we want to see the same elements selected in the other view.
- Filtering - We filtered the elements in one view, then we want these filtering to be reflected in the other view.
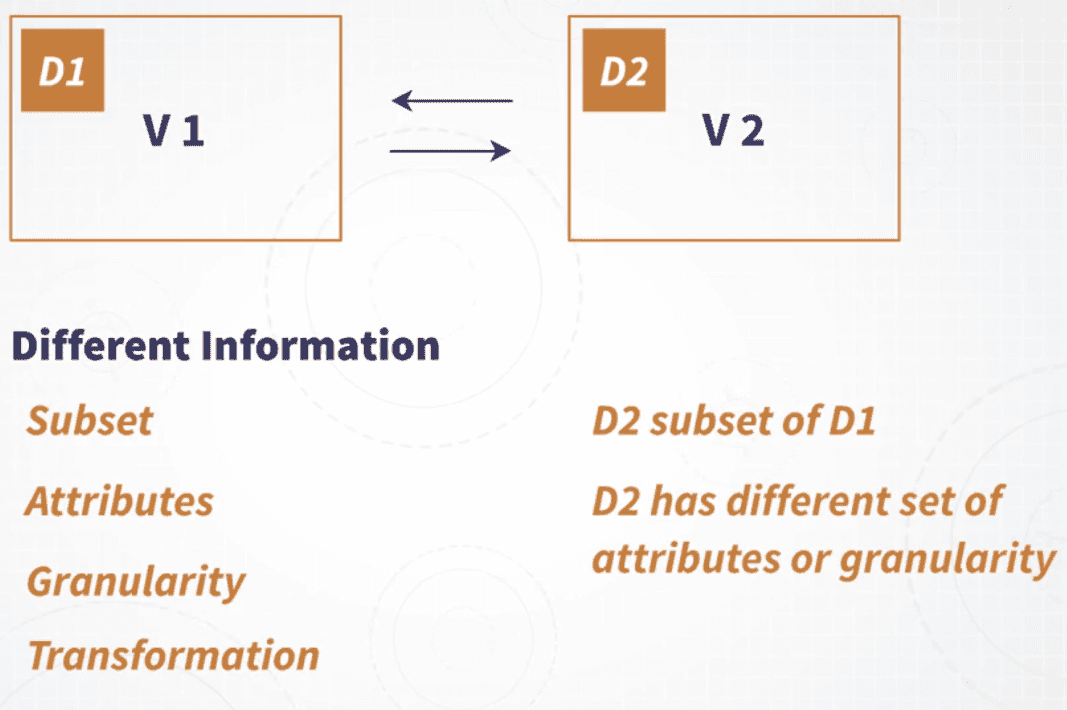
Two main classes of methods that enable to show different properties of the data
- Visualizing in the first view and the second view different information.
- Visualizing information differently with a different visual representation.
Scenarios and Patterns
-
A situation where we have a visualization that contains too much data. Because of that, it can't fit entirely in one single view and you can't resolve it without panning/scrolling.
- The problem with panning/scrolling:
- The first one is that this way it's very hard if not impossible to gain an overview of your data.
- It relies too heavily on human memory.
- Solution: Overview plus detail pattern
- One view is an overview of the whole dataset, with a much much lower resolution.
- In the other view, you can see the details of a region that is selected in the overview view.
- The problem with panning/scrolling:
-
A situation in which we are visualizing data with a given visualization method and to every single data point, we have additional information that is related to these data points, and we will need to visualize in textual format.
- The problem is if we visualize using a scatter plot with every single data point is a label associated that is the actual name of the objects and all of these labels at once, on top of the graphical components of the visualization, we completely overload the visualization.
- Solution: Two separate views
- One view to show the main graphics.
- Another view: We can use a list/table if we want to visualize numerous elements at the same time.
-
A situation where we need to visualize from a given dataset, different aspects of this dataset, or if we wish different sets of attributes of these datasets and we can't fit all of them together in one single visual representation.
- The problem is that it's really hard to integrate all of the multiple attributes, in one single visual representation.
- Solution: Two separate views
- Place every single facet in a different view and then link them together using interaction.
Conclusion
Every time you are employing some interaction methods or some multiple view methods in your visualization design, ask yourself, what are the benefits and what are the possible negative consequences and try to convince yourself, if you want to use any of these methods, you have to convince yourself that this is ultimately going to be beneficial.
Did you find this post useful?
I would be grateful if you let me know by commenting below. Means a lot to me!
Sign up to get updates when I write something new. No spam ever.
Comments