
Visualizing Network Data
Introduction
We will see that network data is about datasets that describe connections between objects or relationships between objects.
- Network data -> Object <-Relationships-> Values
- Objects -> Nodes
- Relationships -> Link(Edges)
- Network
- Node-link
- Matrix
- Trees
- Node-link
- Containment Partitioning
Network Visualization Techniques
Node link diagrams
-
Nodes: dots/markers
-
Links: network connecting dots.
-
Force-Directed Layouts
- Nodes are arranged according to attraction and repulsion forces between nodes
- The main goal is to visualize the structure of the network.
- Creation
- Initially nodes present in random positions
- All nodes experience edge attraction and node repulsion.
- For each node calculate the sum of forces insisting on the node.
- Move node according to direction and force.
- Repeat the same process until a stable position is found.
- Many ways of creation exist.
- Additional attributes can be encoded in nodes and link
- Nodes -> Color or Shape or Size
- Links -> Edge Thickness/ Edge Pattern
-
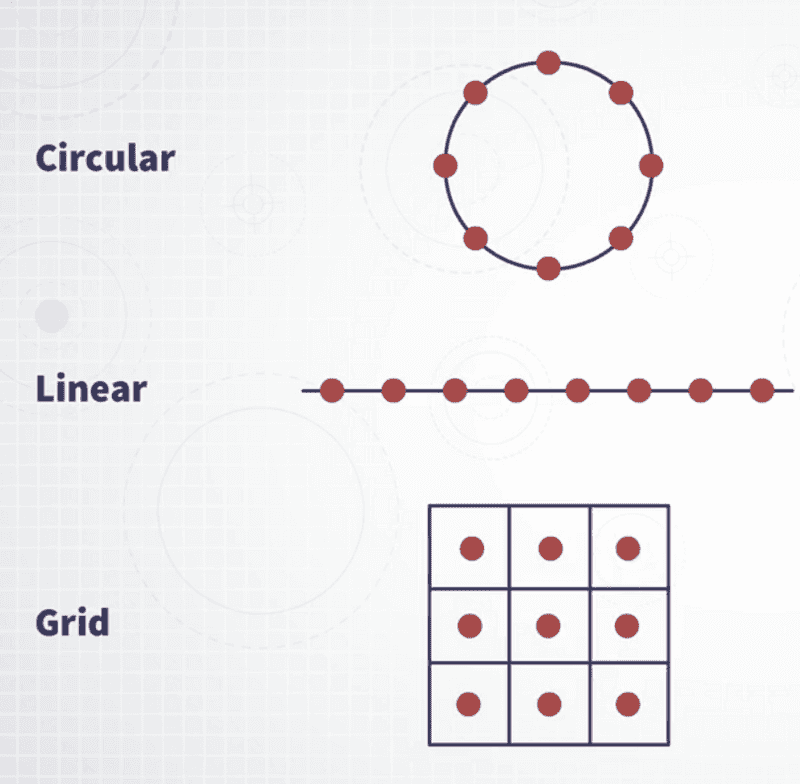
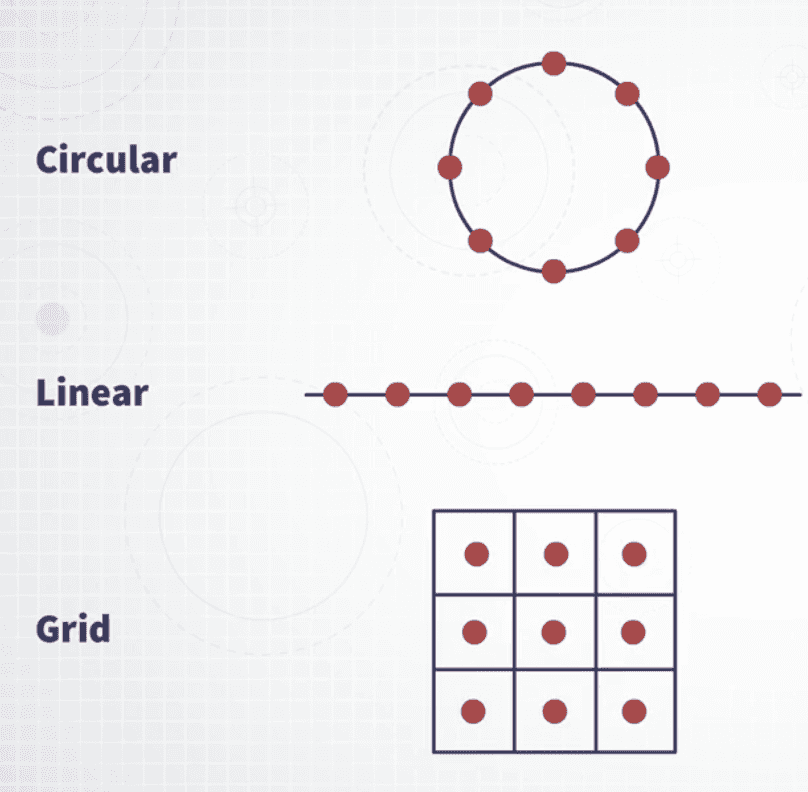
Fixed Layout
-
A layout in which the position of the nodes is fixed from the very beginning according to some criteria.
-
-
Fixed Layout: Spatial
- The fixed layout is a map or spatial location.
- Nodes correspond to spatial locations.
- The flowing is represented by the edges.
-
-
Matrix
-
The idea is to use a matrix where rows and columns represent the nodes and the intersection between a row and a column represents an edge.
-
Advantages
- Node visibility
- No line crossing and avoid Hairball effect
- The matrix needs sorting algorithms to show interesting patterns
- Shows direction with elements above/below the diagonal
-
Disadvantages
- Not Familiar to the general audience.
- Scalability
- Needs Reordering
- Pattern visibility depends on how the matrix is sorted.
-
-
Fixed layout is more appropriate than FDL
- If the problem not related to structure.
- More visibility of nodes, their properties, and degree.
- More visibility of edges and their properties
- The layout is fixed, nodes can be grouped in meaningful/useful categories.
-
Parallel Axes can be also be used to solve the problem of directionality.
Trees(Hierarchies) Visualization Techniques
The basic idea of a tree is that it's a specific kind of network that is organized as a hierarchy.
- There is one single node that is the starting point and it's called the root node.
- Following the root node, there can be two or more children or children, and the structure is organized in a way that every node can have between zero and multiple children and every child can have only one parent.
- It can represent hierarchies and that's the reason why it's so important and pervasive.
Node-link trees
We can represent trees as a collection of nodes represented by visual marks that are connected by lines that represent the relationship between these two nodes.
Examples: Filesystem structures, Phylogenetic trees, Hierarchical lists, and Radical layouts
-
Issues
- Scalability (1D growth) - The higher the number of nodes and the harder it is to fit everything into one single visualization.
- Labeling - It is very important because you want to be able to interpret the meaning of the nodes, but the more labels you have to attach to the nodes, the more clutter you have, and this also has an effect on scalability.
- Encoding Information
-
Special kinds of trees
-
Dendrogram
- It's a binary tree
- They are typically used to represent the result of a specific data mining algorithm that is called Hierarchical Clustering.
- The height of the lines is meaningful. It represents the distance between the object that is below the nodes.
- They are often used in biology but very versatile.
- Works well with matrix visualizations of multivariate data.
- Useful to group and visualize any set of complex objects on the top of which a distance function can be defined.
-
Decision Trees
- Each node of the tree represents a decision between two or more options.
- Can be computed automatically from "labeled data".
-
Space Partitioning and Containment Methods
The idea is that a different strategy that you can use to visualize hierarchical structures is to partition space and use containment as a way to convey the idea that there is a hierarchy.
-
Treemaps
- Show hierarchy by nesting together with several shapes. E.g Rectangles
- Partitioning by juxtaposing areas one next to another.
- It can visualize:
- Area -> Quantity
- Color -> Quantity/Category
- Hierarchy -> Nesting
- Incredible Scalability
- Can use color maps to visualize categories
- Slice and Dice Layout: Treemaps were constructed by progressively splitting the rectangle and then changing the direction. So, first vertical then horizontal then vertical, horizontal, and so on. This treemap algorithm is called the Slice and Dice method.
- Problems:
- This method tends to create rectangles that are very thin and very elongated.
- When rectangles have very different aspect ratios, comparing area gets harder.
- Squarified, Voronoi, Circular, and Caution Tree Maps.
- Advantages:
- Scalability, node visibility, no overlapping marks
- Can encode size and color
- Disadvantages:
- Size is not the most accurate channel.
- Structure hard to visualize.
-
Sunburst and Icicle plots
- The sunburst is a visualization technique that strikes a balance between the need of showing the hierarchical structure but at the same time, being as scalable as possible.
- Icicle plot is equivalent in the planar projection.
- Sunburst -> 2D
- Icicle plots -> 1D
- Use Spaceless efficiently but the hierarchy is easier to perceive.
Clutter Reduction Methods
-
Edge Bundling
-
The idea is that when we have too many lines and these lines are crossing and creating a lot of clutter, we can reduce the clutter and hopefully facilitate the perception of the direction of these lines by bundling them together.
-
The idea is to use a method that interpolates between the points of the hierarchy of the structure so that all the lines that go through similar paths get bundled together.
-
One problem that may happen with this technique, is that if lines that follow a similar path pass exactly through the same path, maybe occluded. So, an additional interesting technique that has been added in the method, is the idea of adding different factors to group together or disentangle lines that pass through similar positions.
-
-
Clustering
- Grouping nodes according to how much they are connected.
-
Aggregation/Simplification
- The idea is to group nodes and or edges together
-
Drawing Edges on demand
-
Removing the edges
Obseravations
Now, before concluding, I want to come up with some observations
-
Node-link diagrams are very good for visualizing structure, but often they create clutter(limited scalability).
-
Node-link trees are very good for visualizing the structure and they are very intuitive but do not scale well.
-
Nodes and edges can be used to encode information. Typically,
- Line -> Width and Pattern
- Node -> Size, Color and Shape
-
Matrix has good visibility properties(no line crossings) but needs to be reordered and does not scale well either with the number of nodes.
-
Fixed Layouts are not good for structure. Some designs need node reordering but very expressive when node placement is meaningful and/or focus is not on structure.
-
Treemaps scale much better and make values much more visible. The structure is almost entirely lost.
-
Sunburst and Icicle plot is interesting alternatives to consider. Scale well and retain some structure(low familiarity).
-
Properties/Trade-offs:
- Clutter
- Scalability
- Structure(Node-link diagram)
- Reordering/Aggregation
- Familiarity
- Intutiveness
Did you find this post useful?
I would be grateful if you let me know by commenting below. Means a lot to me!
Sign up to get updates when I write something new. No spam ever.
Comments